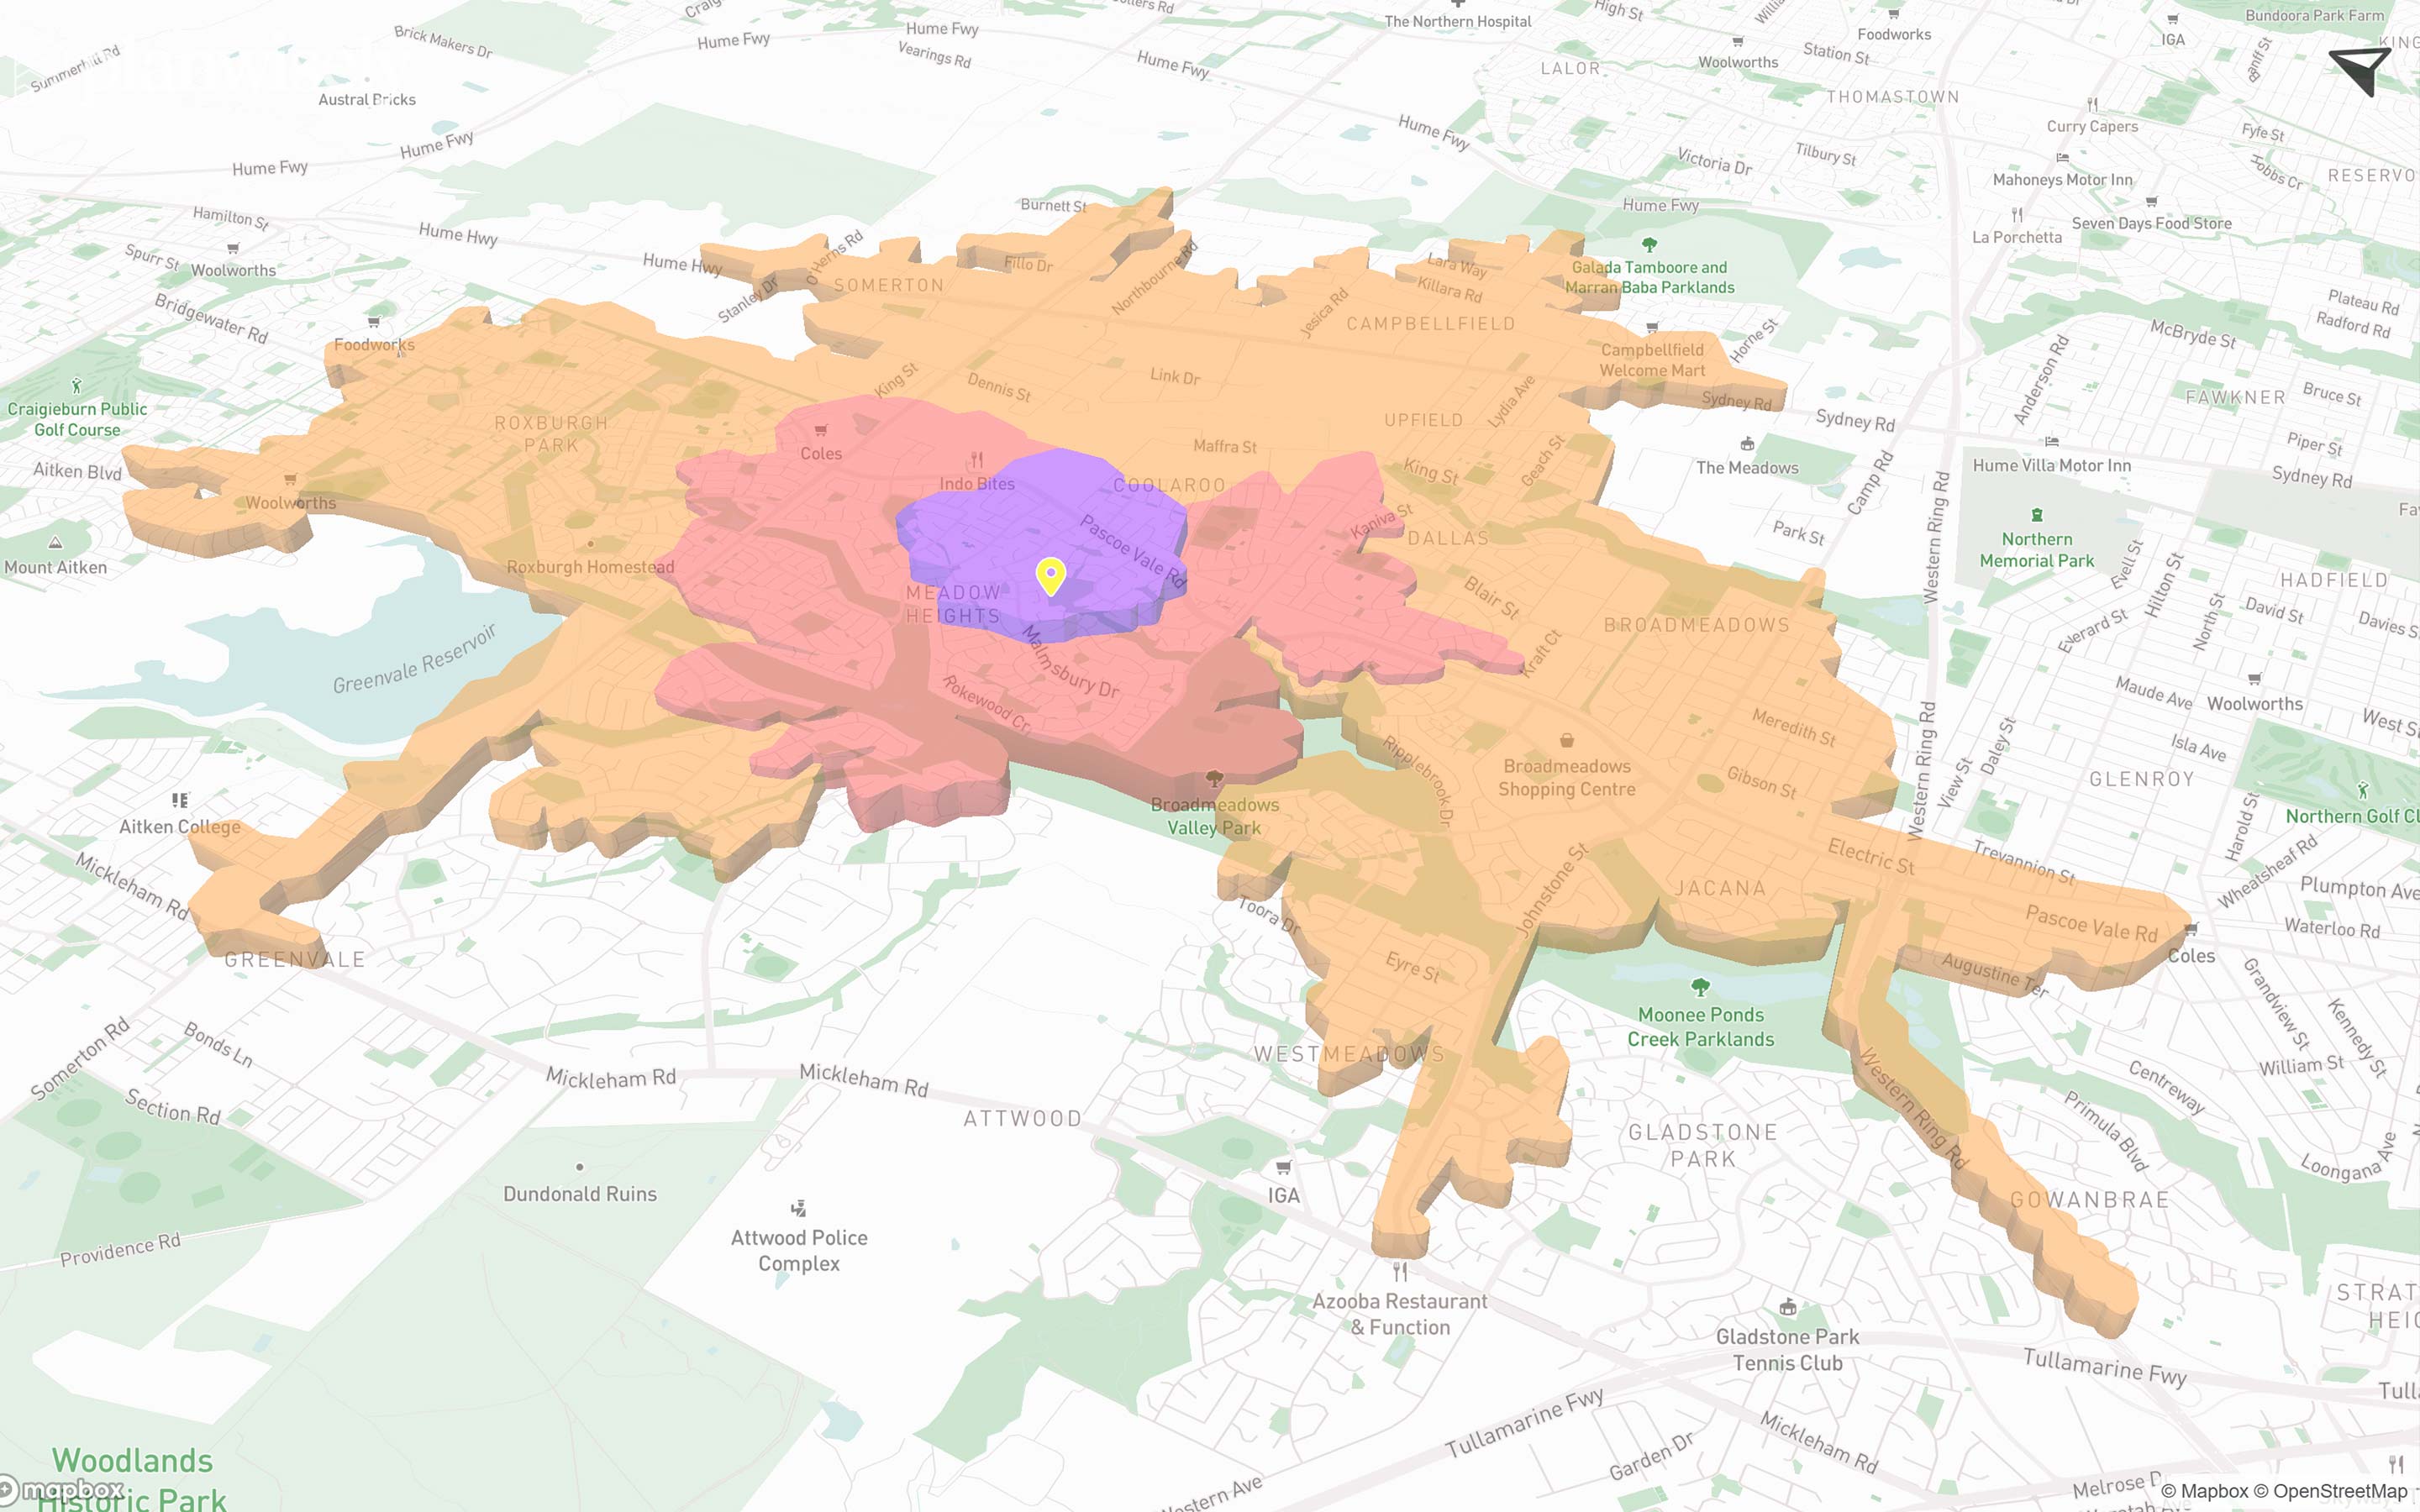
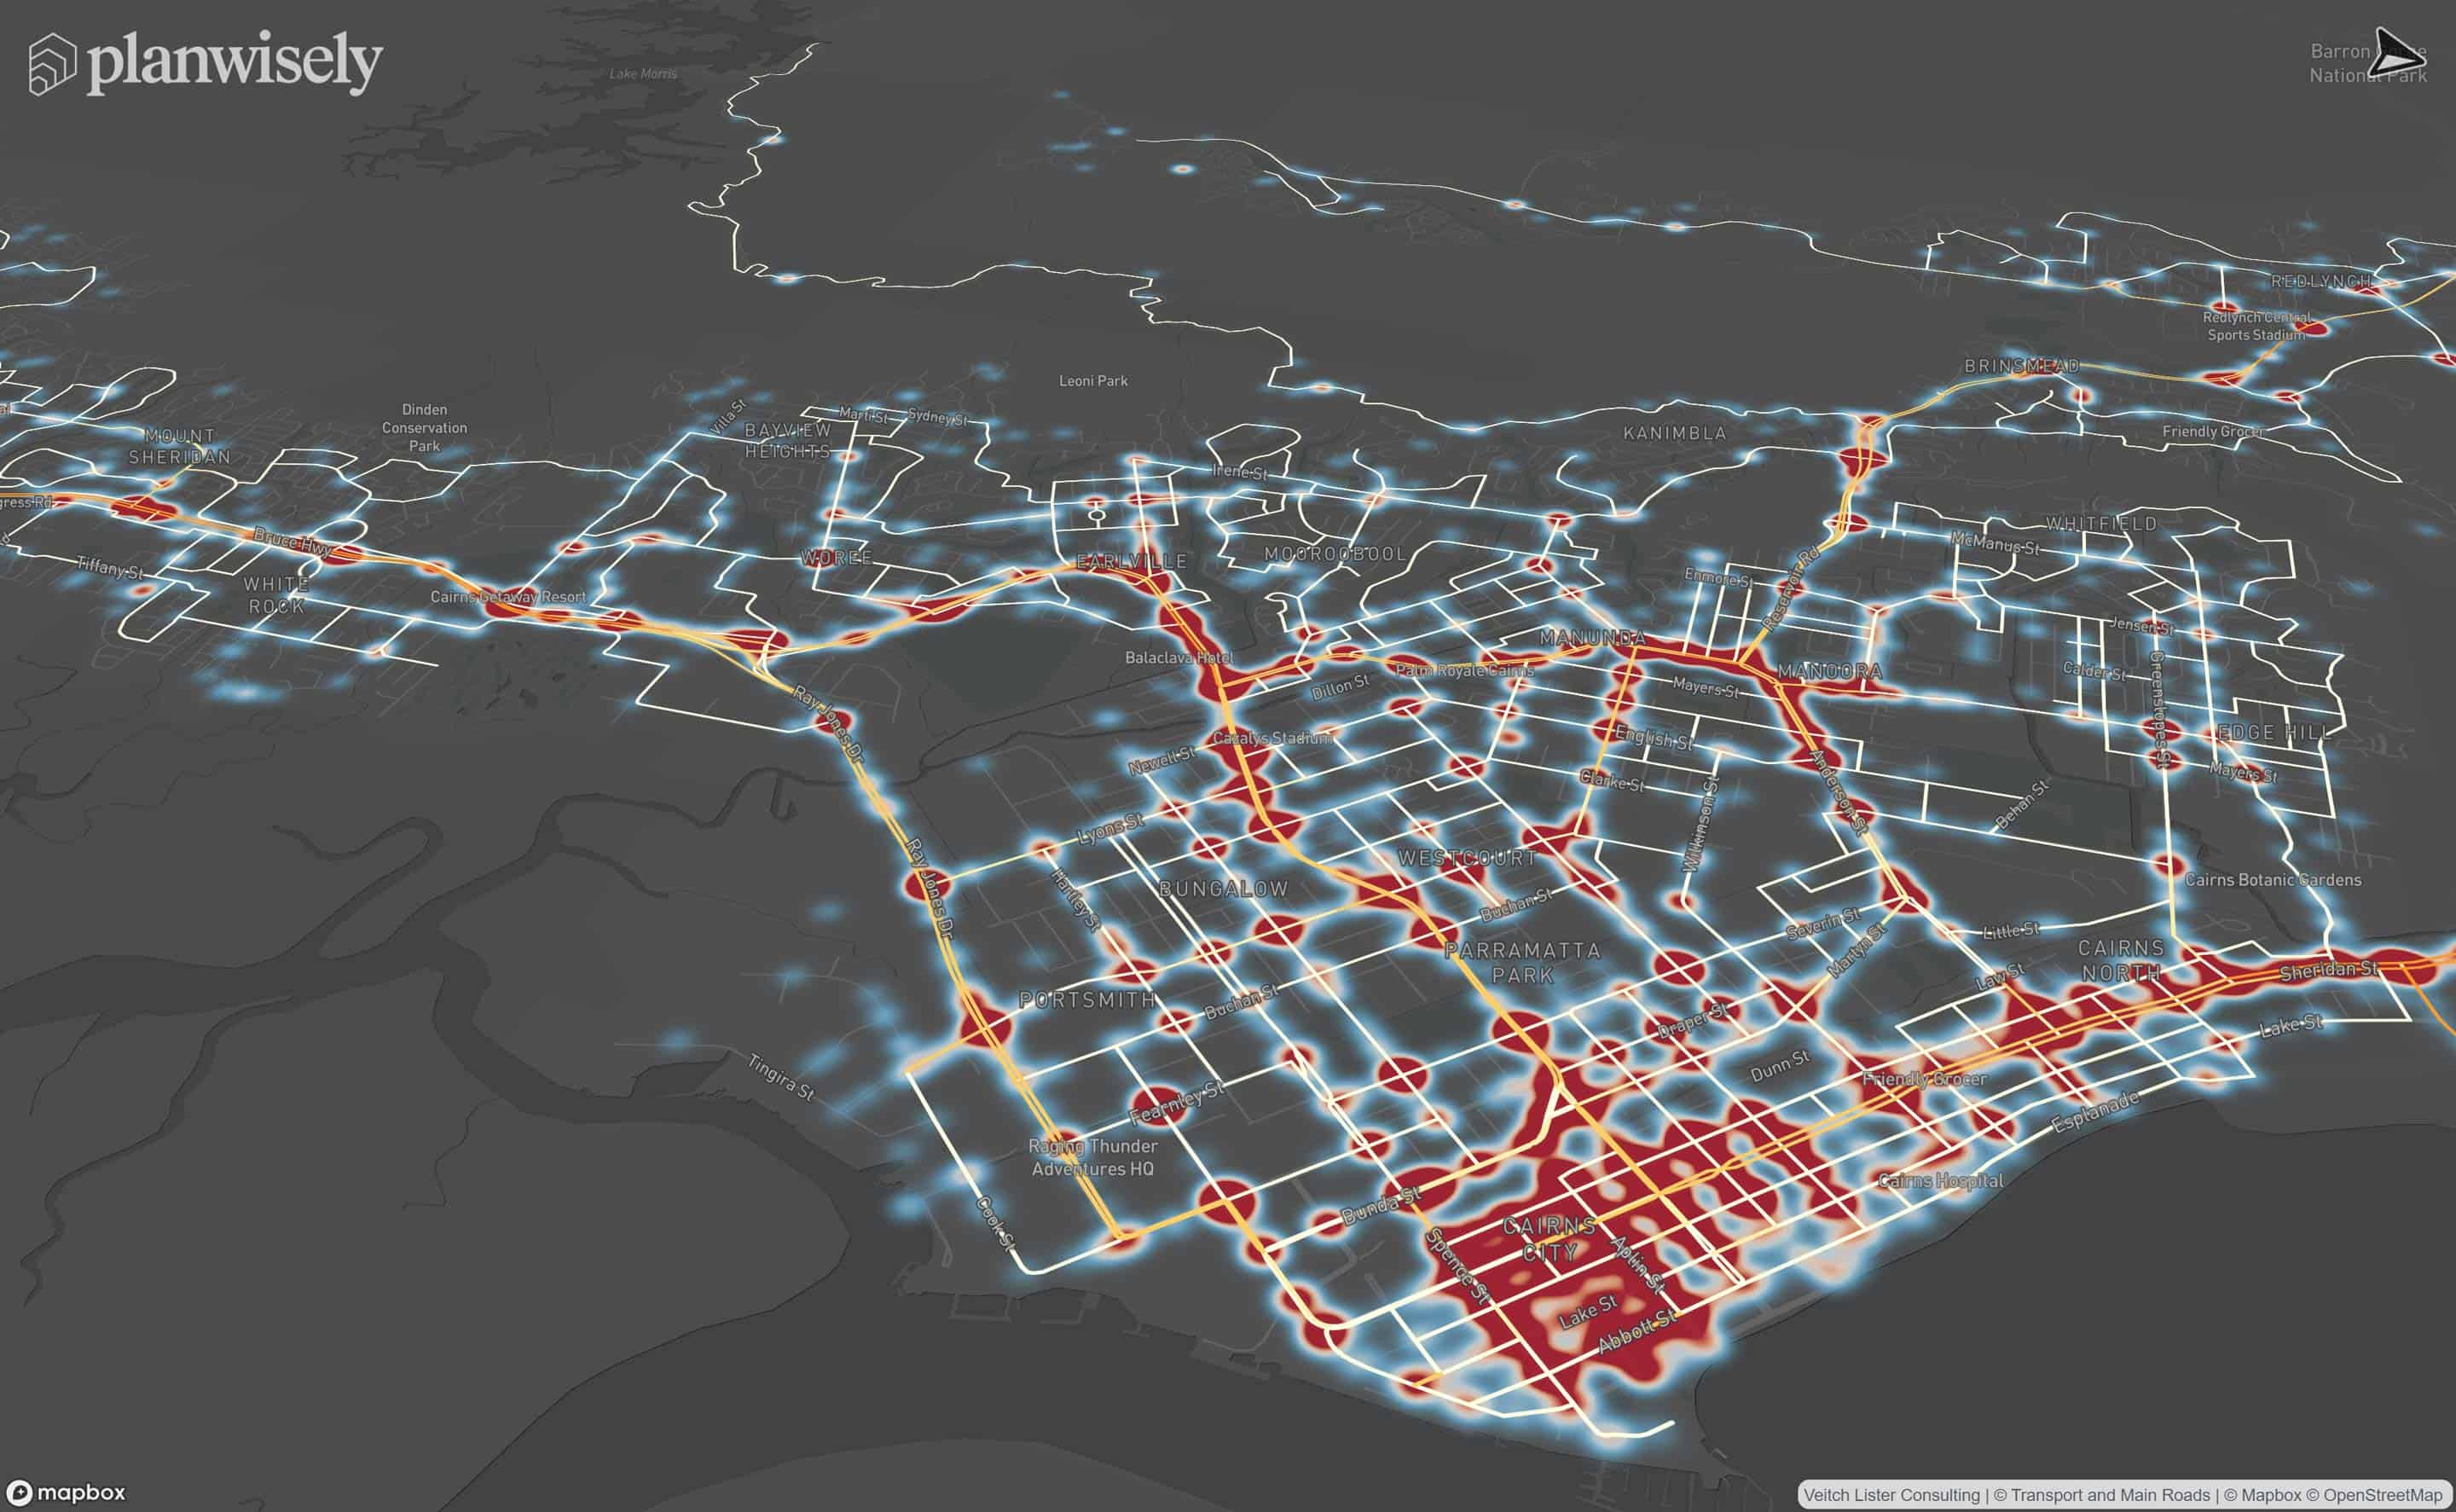
Planwisely is a map-based platform, which means understanding how to navigate and manipulate the map can make visualising data and finding insights easier.
Planwisely allows you to visualise buildings and terrain in 3D to aid your analysis and map visualisations.
Planwisely has multiple base map layers to choose from to suit your analysis.
There are five standard base map layers to choose from in Planwisely:
- Light - a subtle map designed to provide geographic context while highlighting the data you overlay on the map.
- Dark - a dark version of the light map that is subtle enough to highlight cartographic features without distracting from the data visualised on the map.
- Colour - adds colour to the map to enhance the appearance of road networks and parks and recreation areas.
- Satellite - satellite imagery provides real-life context to the data visualised on the map.
- Live traffic - displays real-time traffic conditions on a map. The tileset provides constantly updating congestion information on top of Mapbox Streets road geometries.
%2520(1).jpeg)
%2520(1).jpeg)
%2520(1).jpeg)
%2520(1).jpeg)
%2520(1).jpeg)
Learn how to move around the map, find locations and change the map view in Planwisely.
Recommended Articles
Adding your own local data
You can visualise and analyse your own datasets quickly and securely in Planwisely.

The catchment analysis tool
Analyse accessibility and generate demographic reports using Planwisely's catchment analysis tool.

Map controls and navigation
Discover the essentials on how to get around the map in Planwisely.


