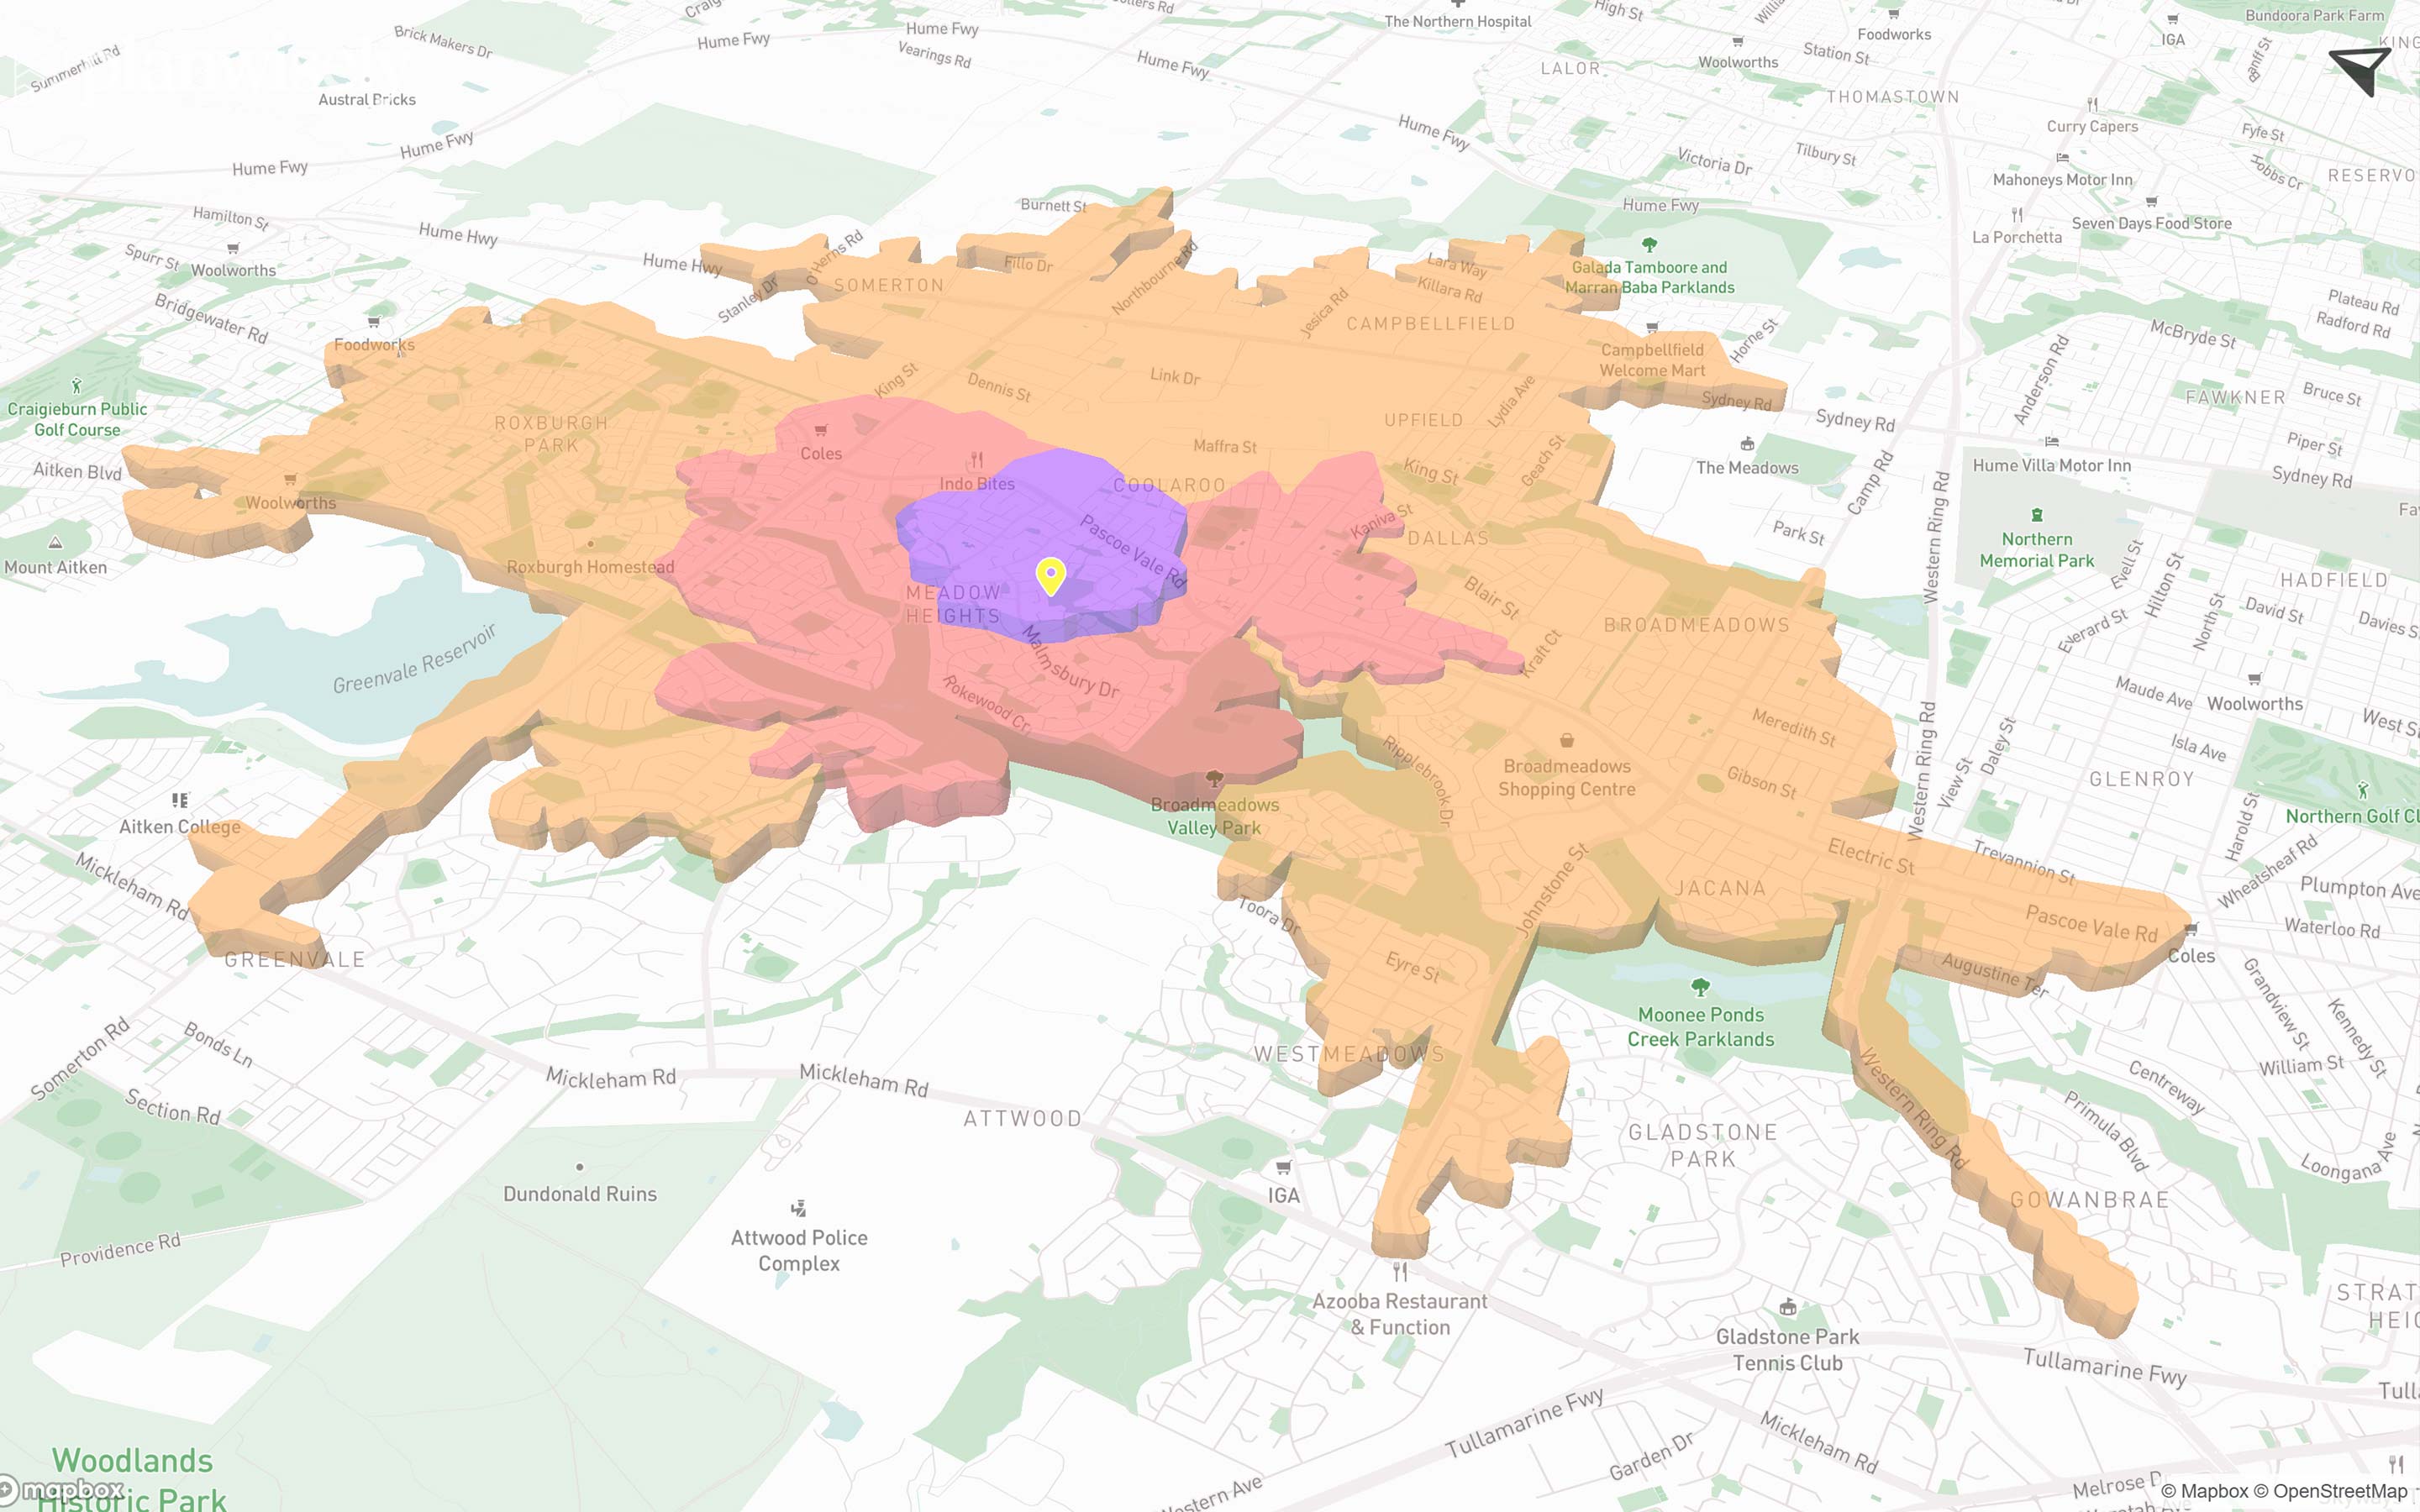
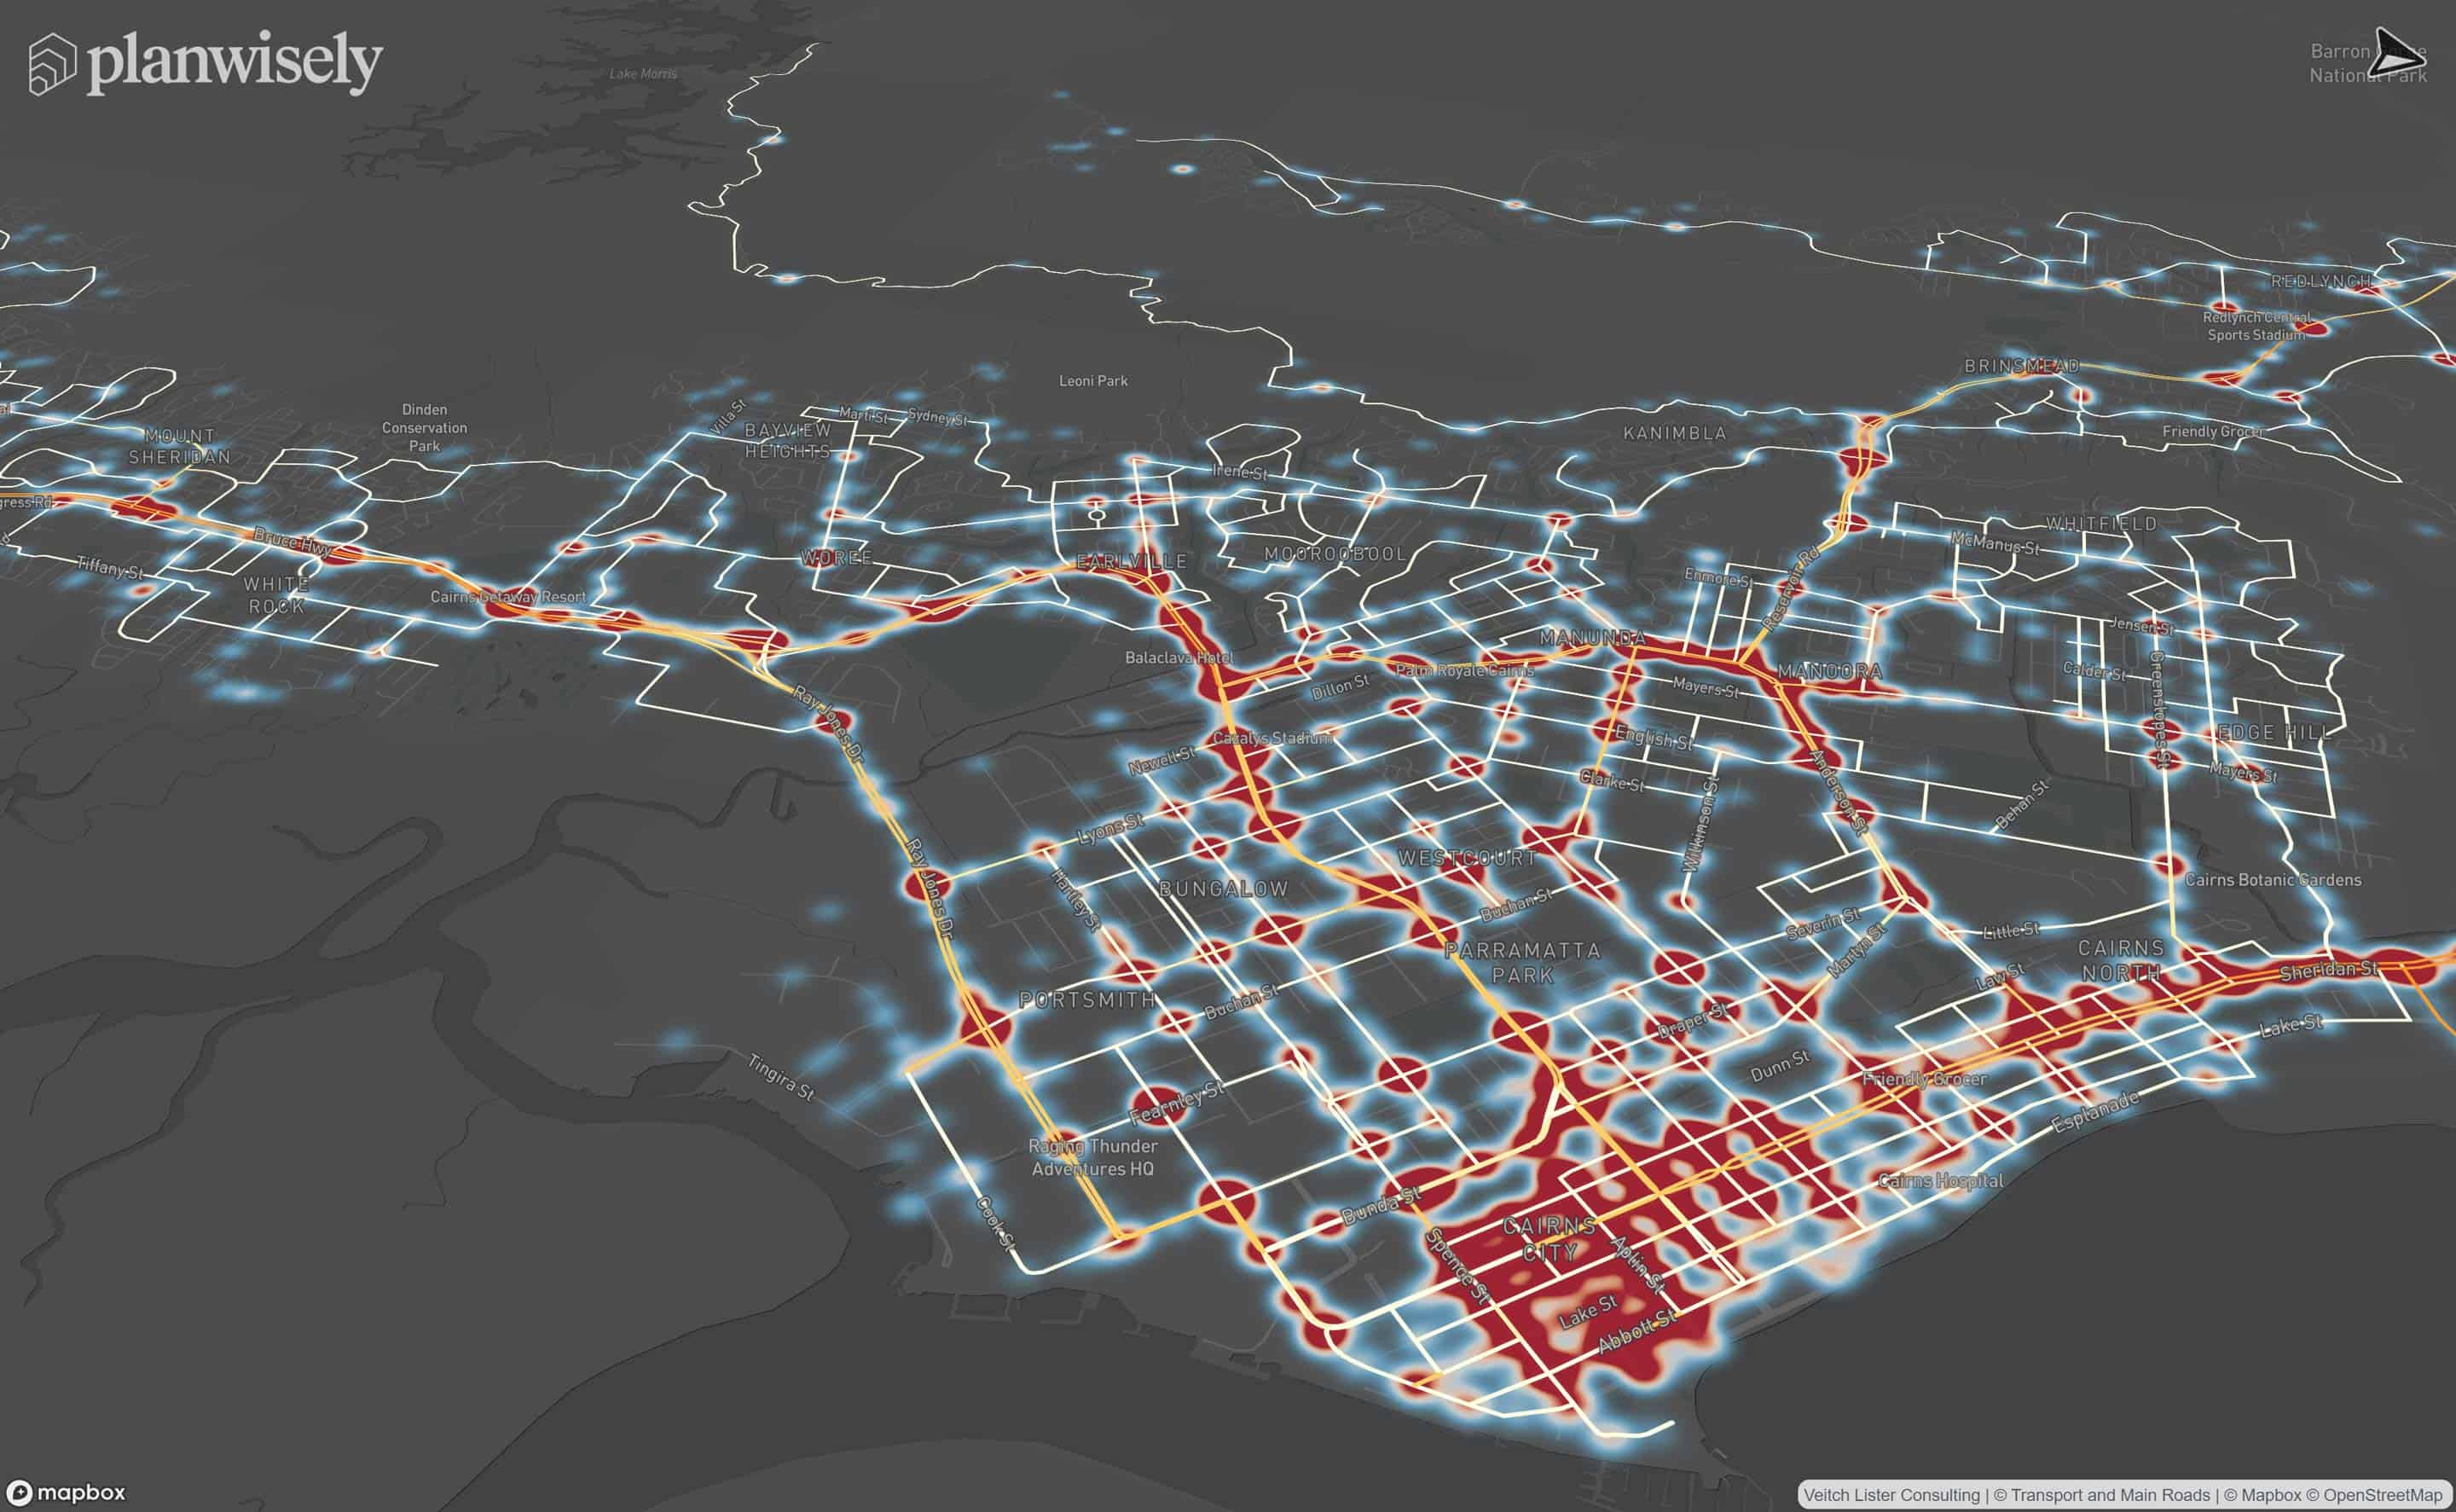
Customise the map and conduct measurements to create or add context to your visualisations.
You can use Planwisely to customise the map with shapes, text and icons and more by selecting Drawing from the Ribbon menu.
heading
Lorem ipsum dolor sit amet, consectetur adipiscing elit.
{{intro_rich_text}}
{{content_rich_text}}
Draw lines and define boundaries within the measuring tool to measure distance and area on the map.
heading
Lorem ipsum dolor sit amet, consectetur adipiscing elit.
{{intro_rich_text}}
{{content_rich_text}}
Recommended Articles
Adding your own local data
You can visualise and analyse your own datasets quickly and securely in Planwisely.

The catchment analysis tool
Analyse accessibility and generate demographic reports using Planwisely's catchment analysis tool.

Map controls and navigation
Discover the essentials on how to get around the map in Planwisely.


