In addition to the open data library that's available to all users, Planwisely has exclusive data layers that are accessible to users who have purchased the add-on.
When selected, traffic counts are pinpointed on the map and coloured according to their average traffic totals.

You can filter the data to show traffic counts by:
- Average weekday traffic total
- Average weekday traffic AM peak
- Average weekday traffic PM peak
- Average weekday traffic mid-day
- Average weekday traffic off-peak
Turning on Labels will display specific counts above each count location.
You can also adjust the colour palette and opacity, as well as toggle visibility on the legend.
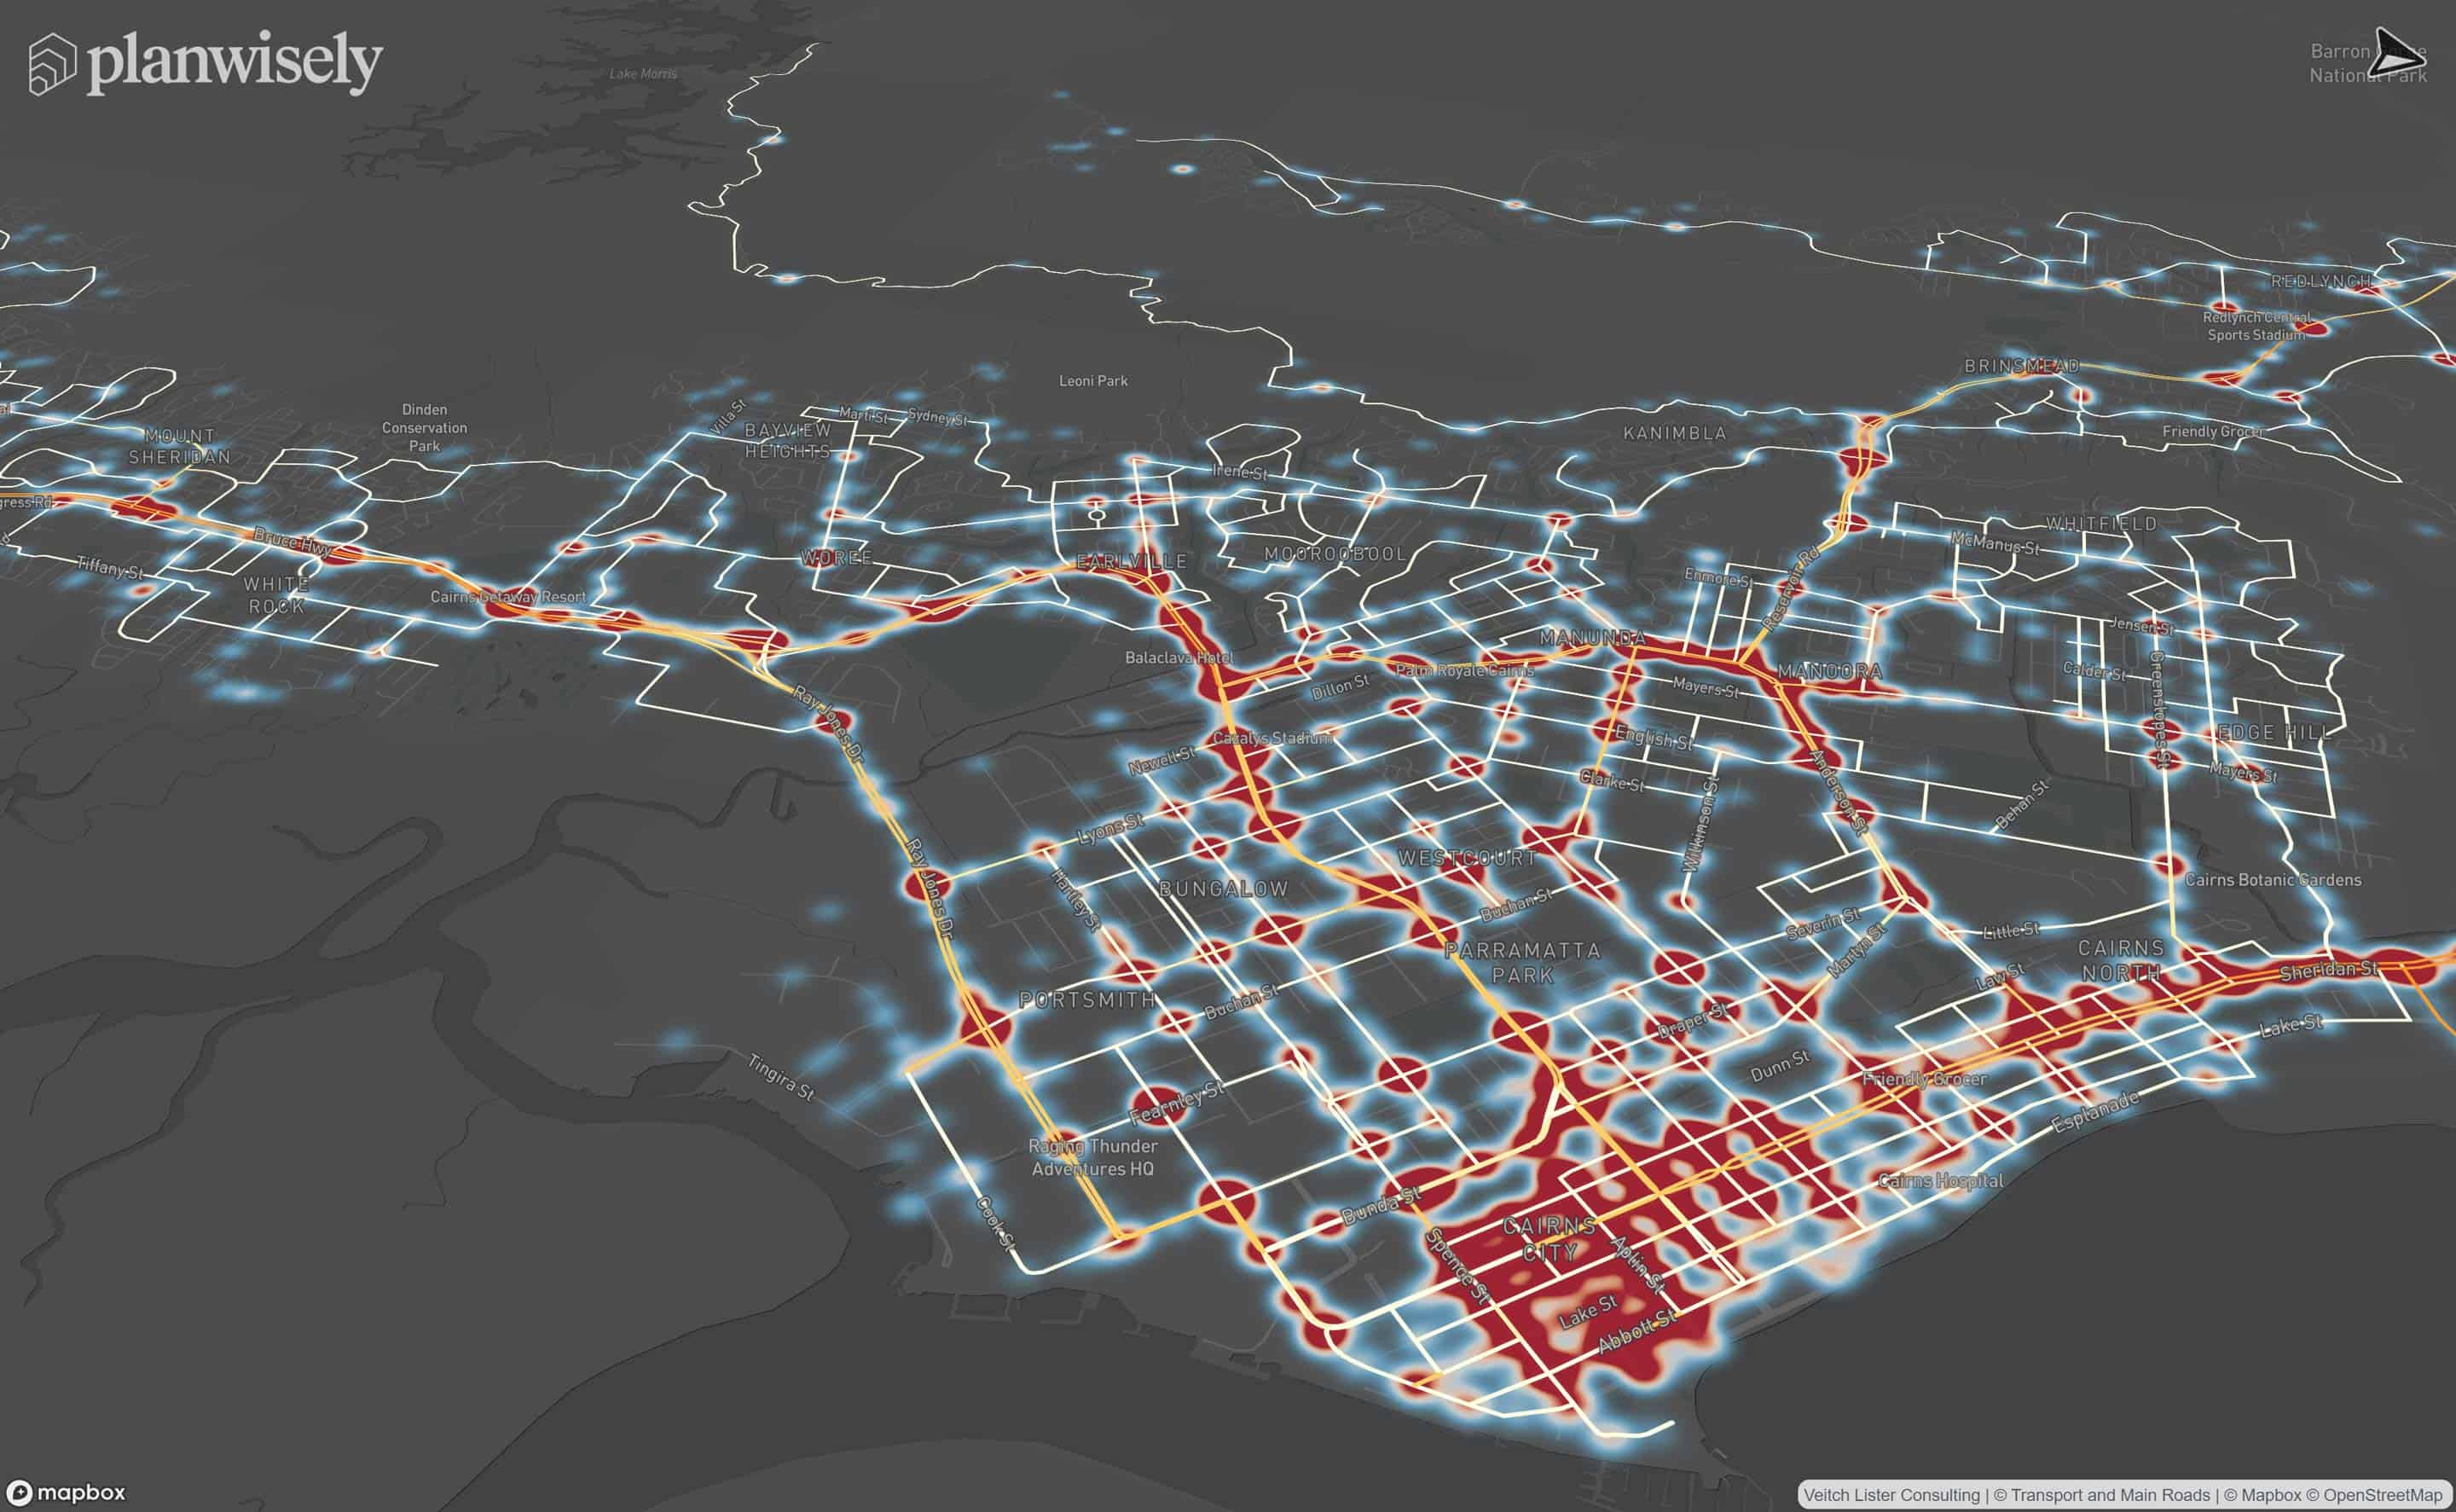
Available in two tiers - Pro and Advanced - Zenith Traffic Estimates is informed by household and demographic profiles of individual suburbs and complex modelling of travel behaviour, allowing you to view aggregated daily travel patterns at a glance.
Coverage includes:
- North Queensland (Cairns, Townsville, Bowen, Mackay)
- South East Queensland (Brisbane, Sunshine Coast, Gold Coast, Toowoomba)
- Northern New South Wales
- Sydney
- Newcastle and Wollongong (west to the Blue Mountains)
- Canberra, Queanbeyan and surrounds
- Melbourne region (including Geelong, Bendigo and Ballarat)
- Greater Adelaide
- Greater Perth
heading
Lorem ipsum dolor sit amet, consectetur adipiscing elit.
{{intro_rich_text}}
{{content_rich_text}}
Recommended Articles
Adding your own local data
You can visualise and analyse your own datasets quickly and securely in Planwisely.

The catchment analysis tool
Analyse accessibility and generate demographic reports using Planwisely's catchment analysis tool.

Map controls and navigation
Discover the essentials on how to get around the map in Planwisely.


