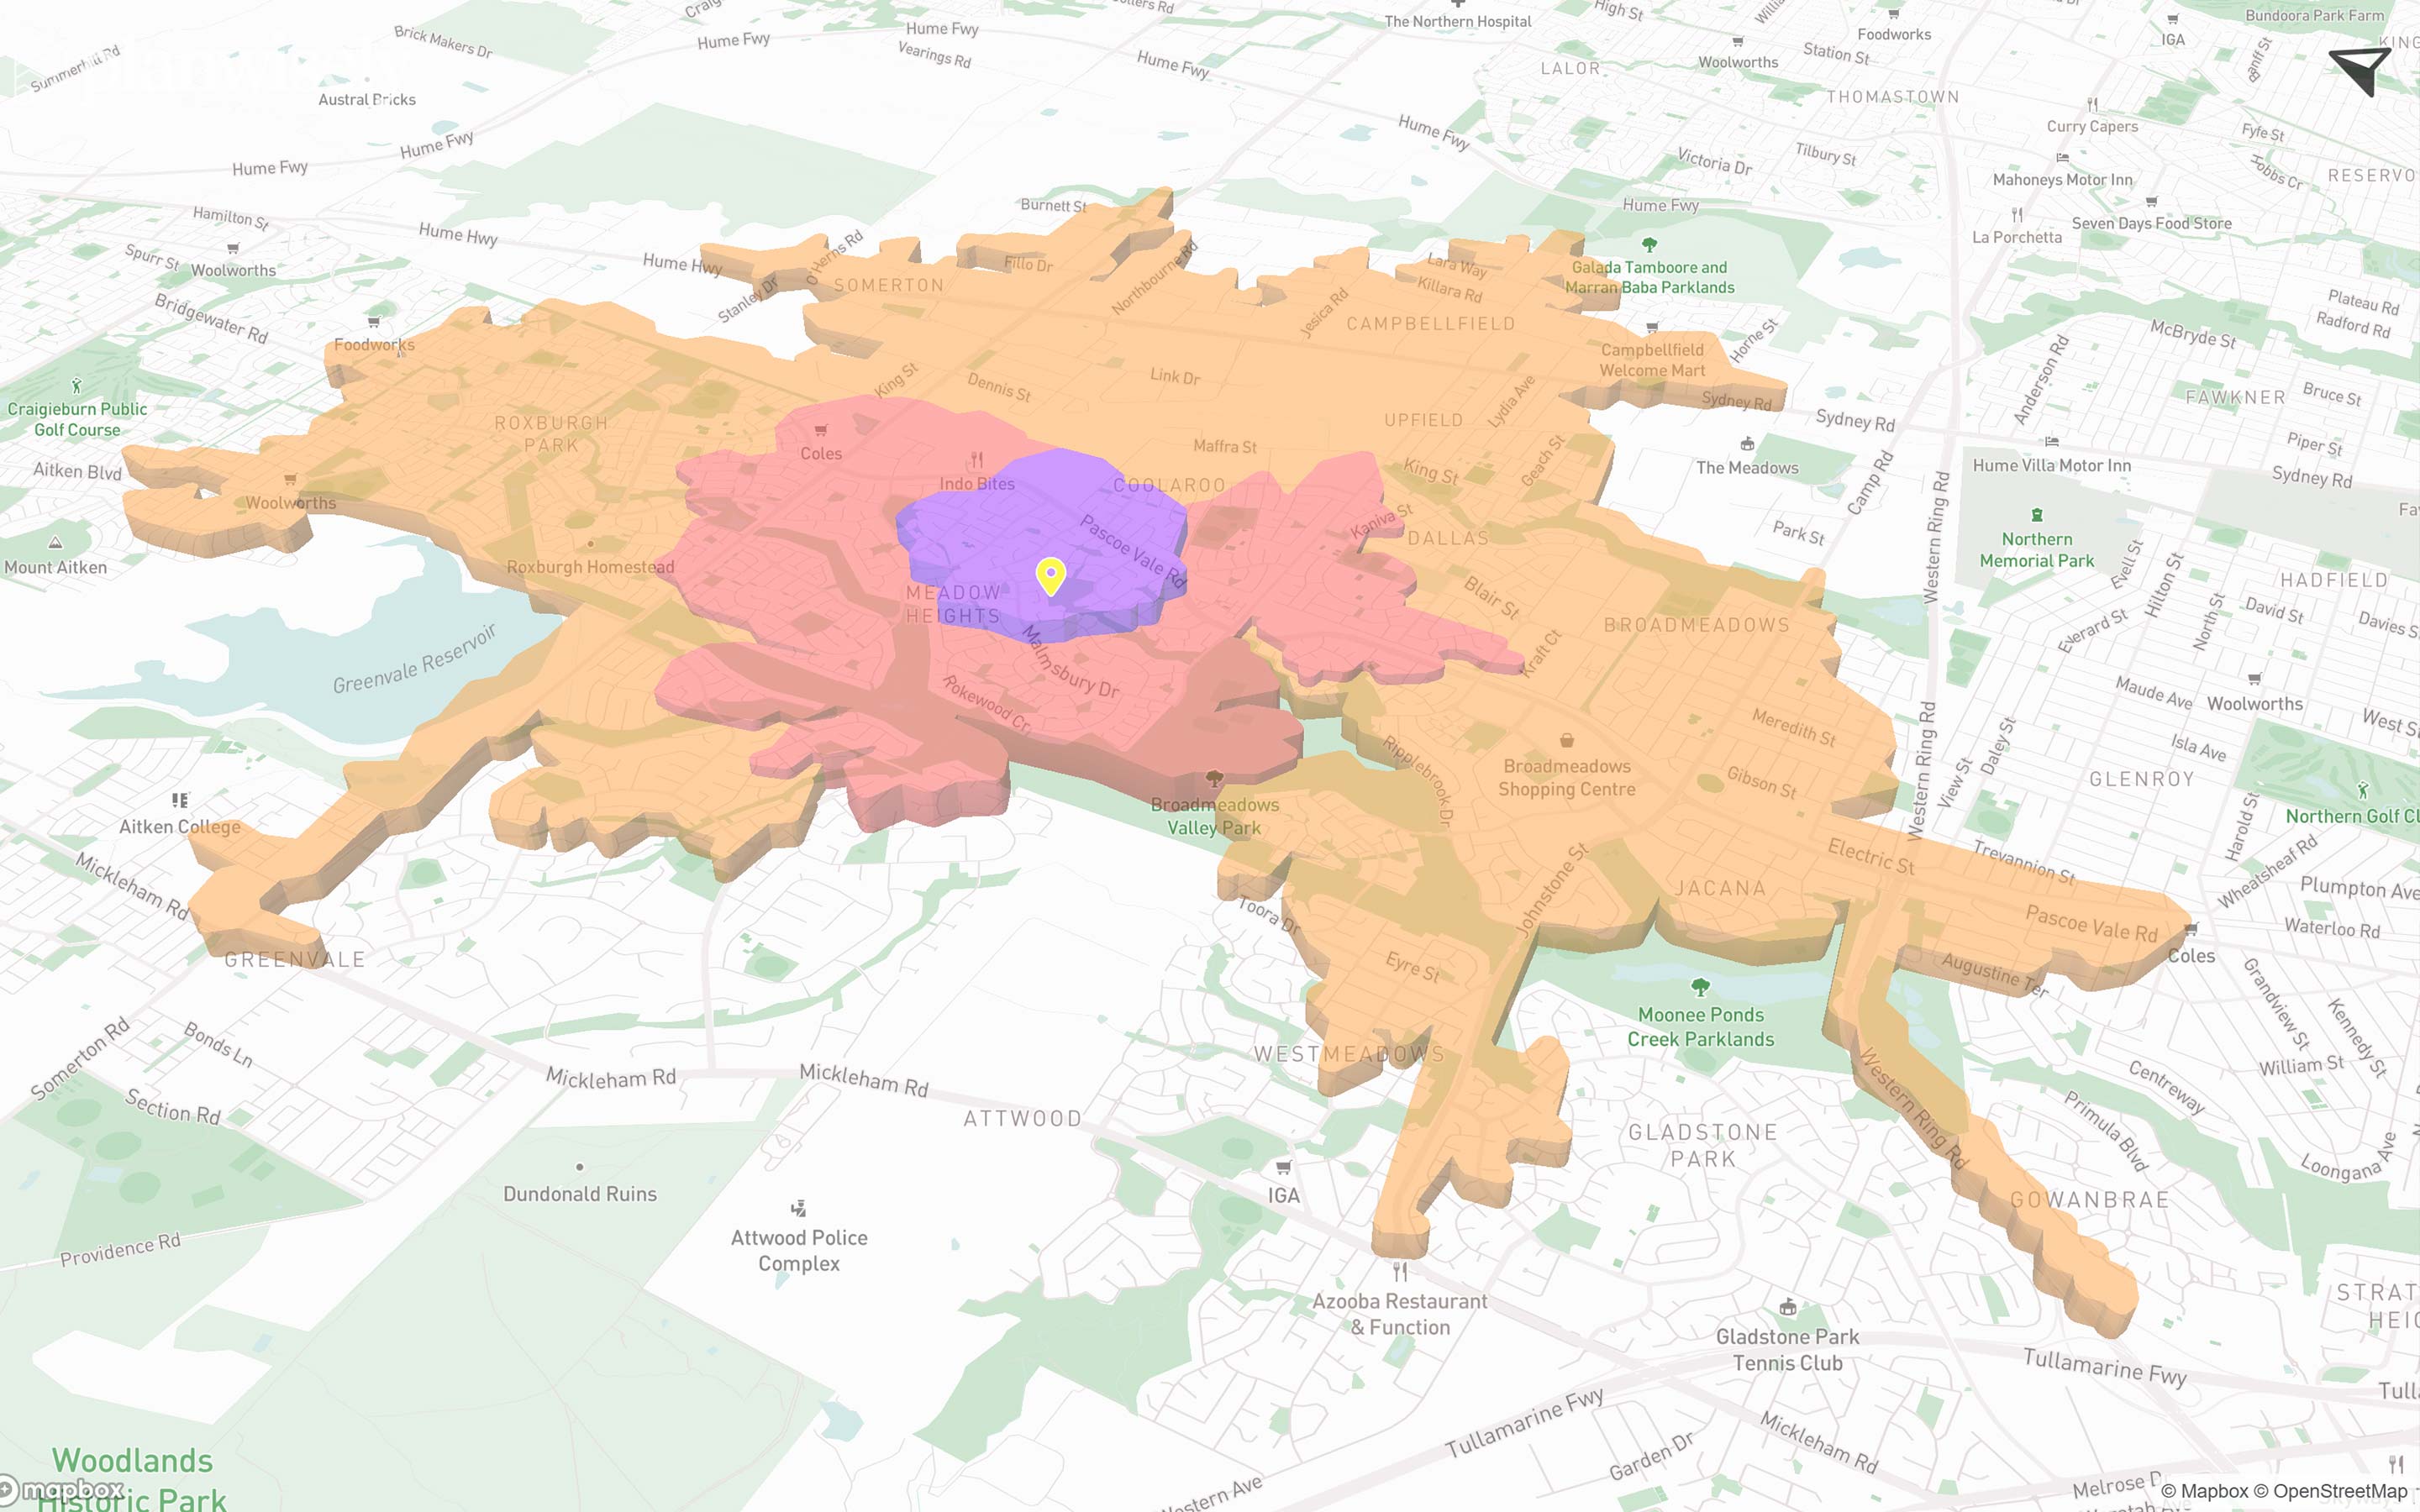
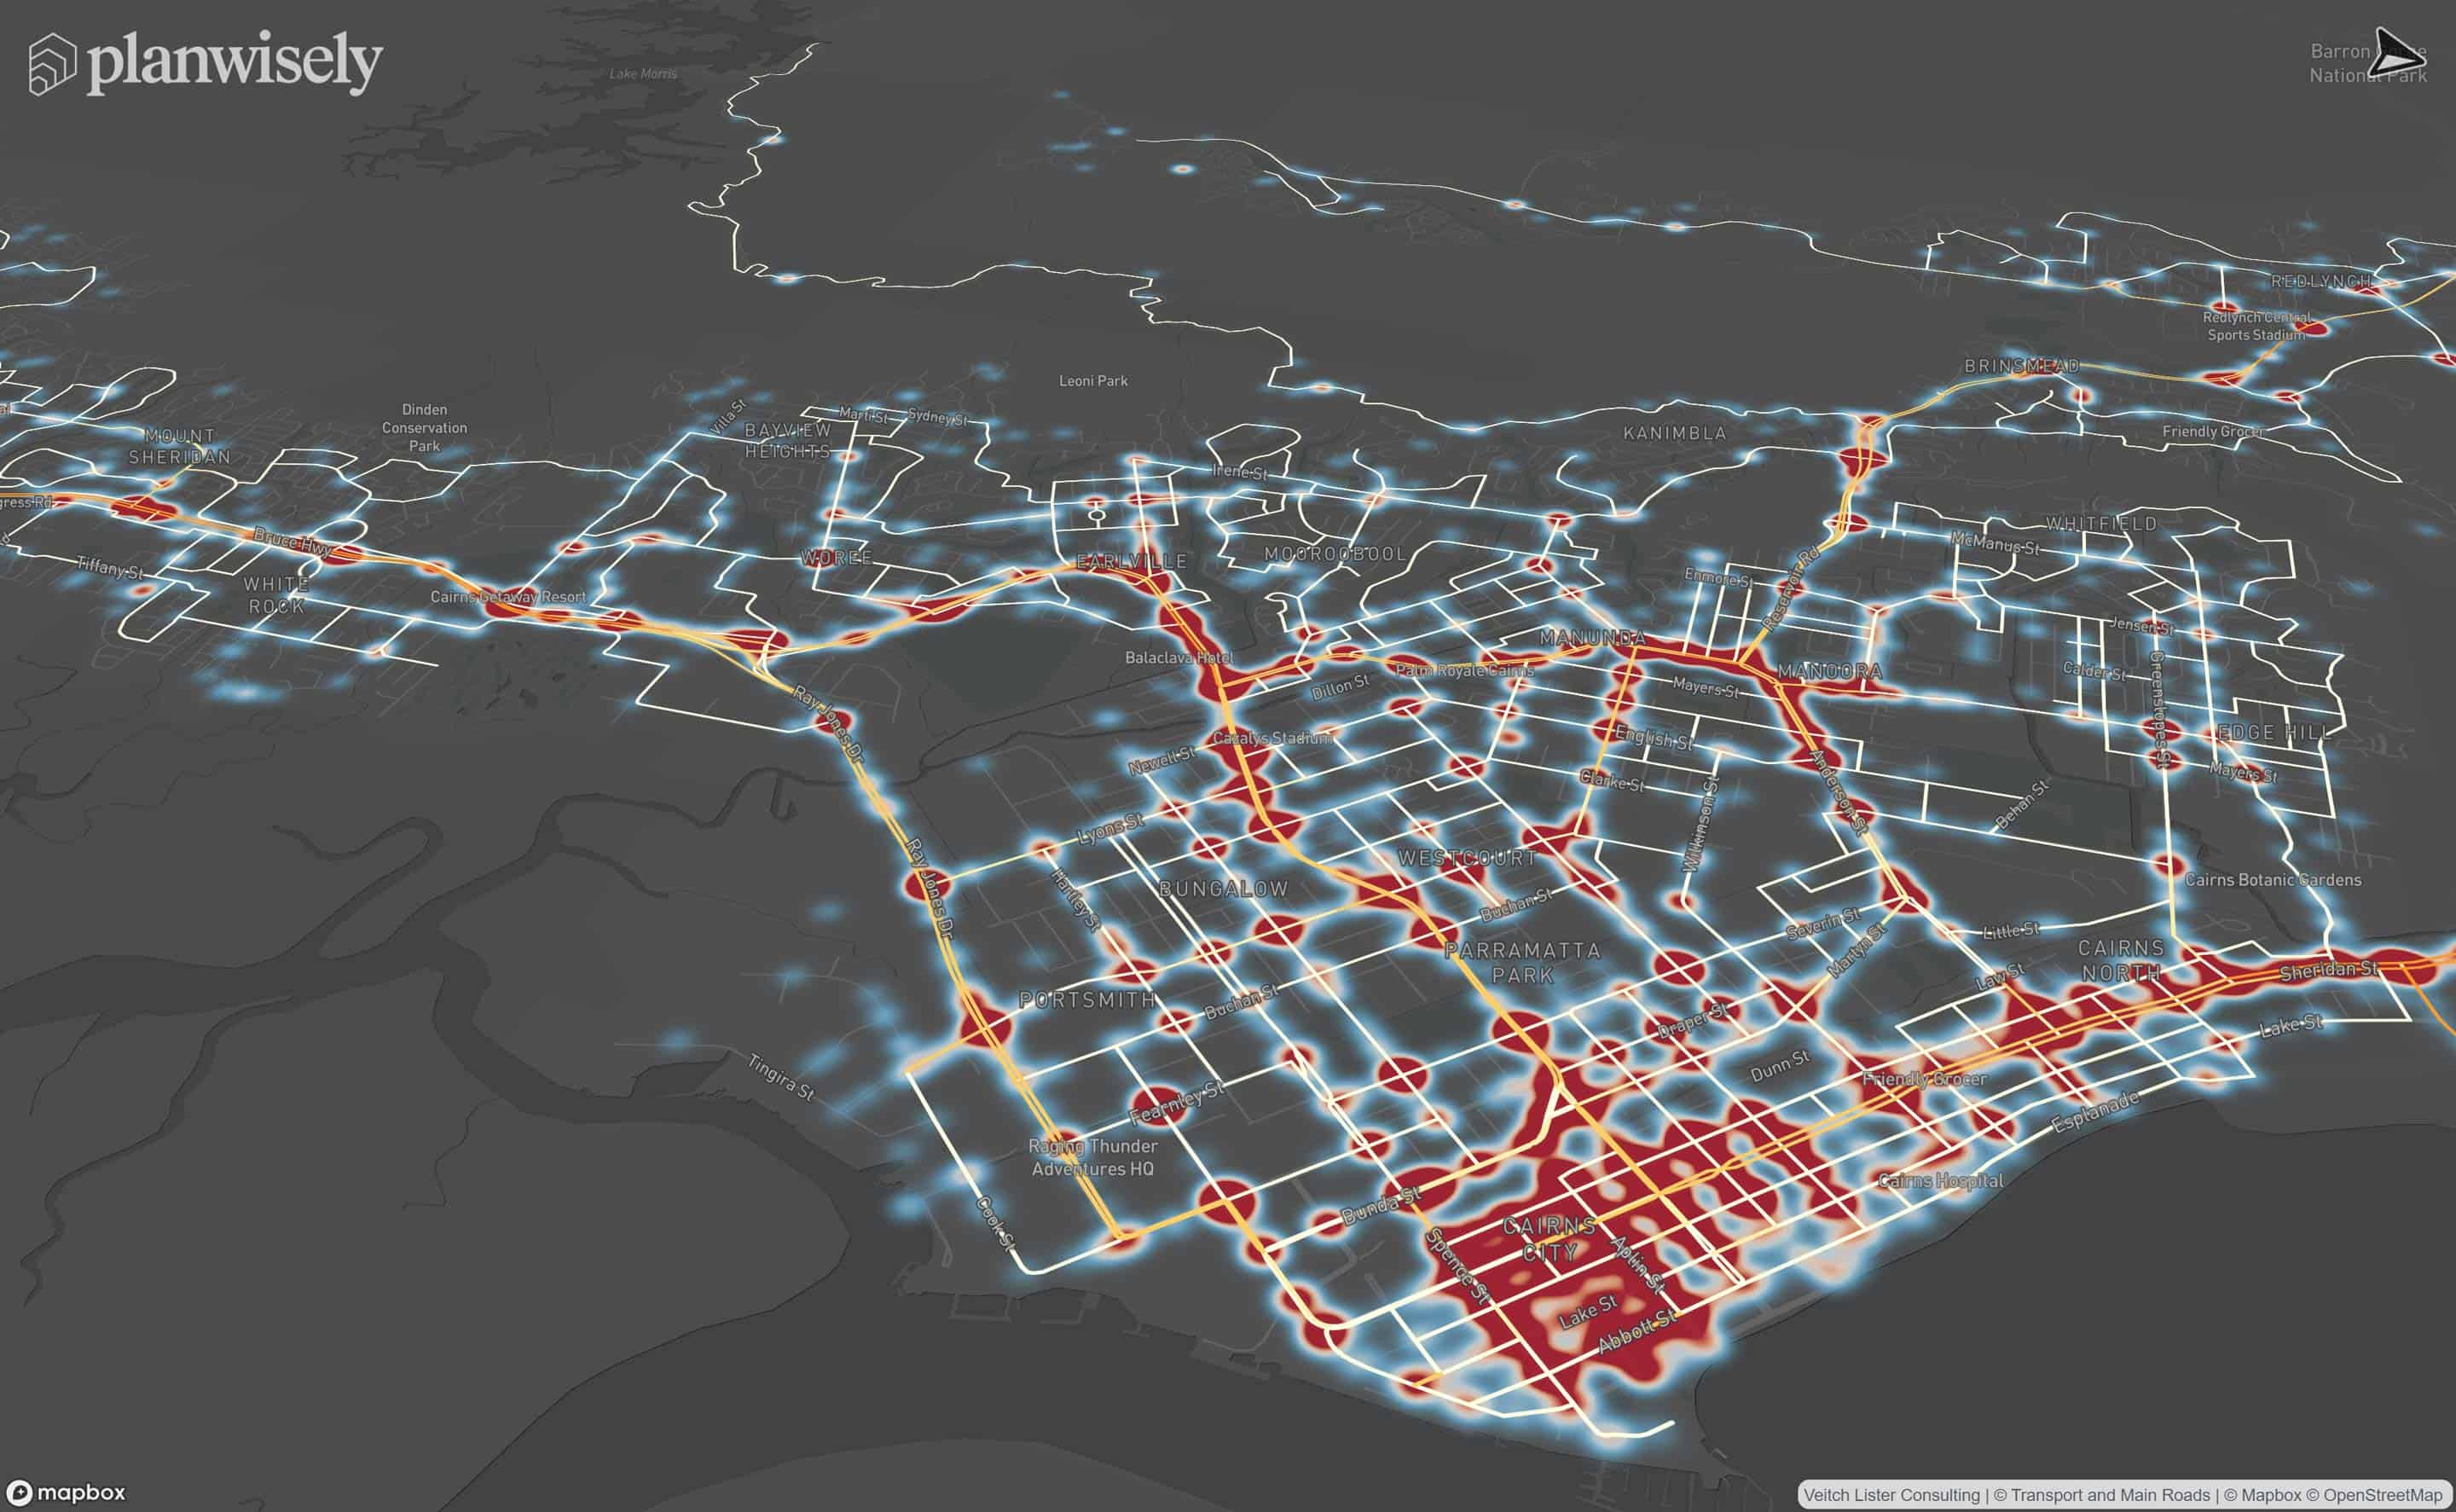
Catchment analysis allows you to investigate accessibility within a given radius to a specific location based on a travel time and mode or a simple radius.
To access the Catchment Analysis Tool, select the Pin icon from the ribbon menu. To run catchment analysis, you first need to select a location.
To begin your analysis, select a location to drop a pin on the map. You can also use the Search bar to place a pin at a specific address.
Keep in mind that your site must be accessible by the road network to generate a catchment. If it isn't, you will receive an error message and you'll be asked to select a different location.
To define your catchment analysis, select the Catchment Settings cog.
From here, you can select which mode you want to analyse for. This includes walking, cycling, public transport, private vehicle or by distance. Public transport options also include day of the week and time of departure to further target your catchment analysis.
Once you have selected your mode, select the desired amount of travel time or distance using the Value slider, which ranges from 2-60 minutes (or 100m - 15km if you select Distance as your mode).
When you're happy with your catchment settings, click Update.
Finally, to visualise your catchment on the map, select Catchment Analysis.

Learn more about using the catchment analysis tool in Planwisely:
After you have visualised your catchment area on the map, you can then generate a demographic report of the people within it.
To create a demographic report, simply expand the site details and select Get Report.
The report will be generated and opened in a new browser tab for you to view. You can also download the report as a PDF.
Included in each demographic report are charts and tables on Historical Population Growth; Gender Breakdown; Personal Income; Age Breakdown, Number of Households with Motor Vehicles; Resident Workers by Industry; Resident Workers by Occupation, with data based on information from the Australian Bureau of Statistics (ABS).

To identify gaps in accessibility, compare catchment areas and more, you can run a gap analysis by analysing multiple catchments at once.
To run a gap analysis, you must first create or upload at least two sites. Once two sites are selected, the Gap Analysis icon will appear. Select it to visualise multiple catchments on the map, allowing you to see gaps and overlaps.

You can visualise catchment areas as shapes to give you different visualisation and export options.
To create a customised catchment analysis, select the Drawing Tool from the menu, then select Draw Point. Once you have placed your point on the map, select Create New Catchment from the Shape toolbox.
Choose your Mode and Value to define your catchment, then select Create to run your analysis for that specific location.
Once you have created your catchment, it will be visible and editable like other shapes in the Drawing Tool.

heading
Lorem ipsum dolor sit amet, consectetur adipiscing elit.
{{intro_rich_text}}
{{content_rich_text}}
Recommended Articles
Adding your own local data
You can visualise and analyse your own datasets quickly and securely in Planwisely.

The catchment analysis tool
Analyse accessibility and generate demographic reports using Planwisely's catchment analysis tool.

Map controls and navigation
Discover the essentials on how to get around the map in Planwisely.


